Foundation in Biology
All living organisms are made up of cells, but cells are too small to be seen clearly with the naked eye. To investigate them in detail, scientists use microscopes as it allows us to make the sample bigger. Microscopy has allowed us to discover the structure of cells, understand their functions, and see how they differ across a wide variety of prokaryotic and eukaryotic organisms (plants, animals, fungi and protists).
Different microscopes produce different types of images.
A light microscope allows us to observe living cells and tissues, though only at limited magnification and resolution.
2.1.1 Cell structure - Microscopes

Course focusing knob – moves objective lens closer or further away from specimen by moving the stage
Fine focusing knob– moves objective lens in smaller steps to focus on particular parts of the specimen

Magnification: The number of times greater that an image is than the actual object.
The eyepiece lens produces a magnified ‘real image’ of the specimen (normally x10)
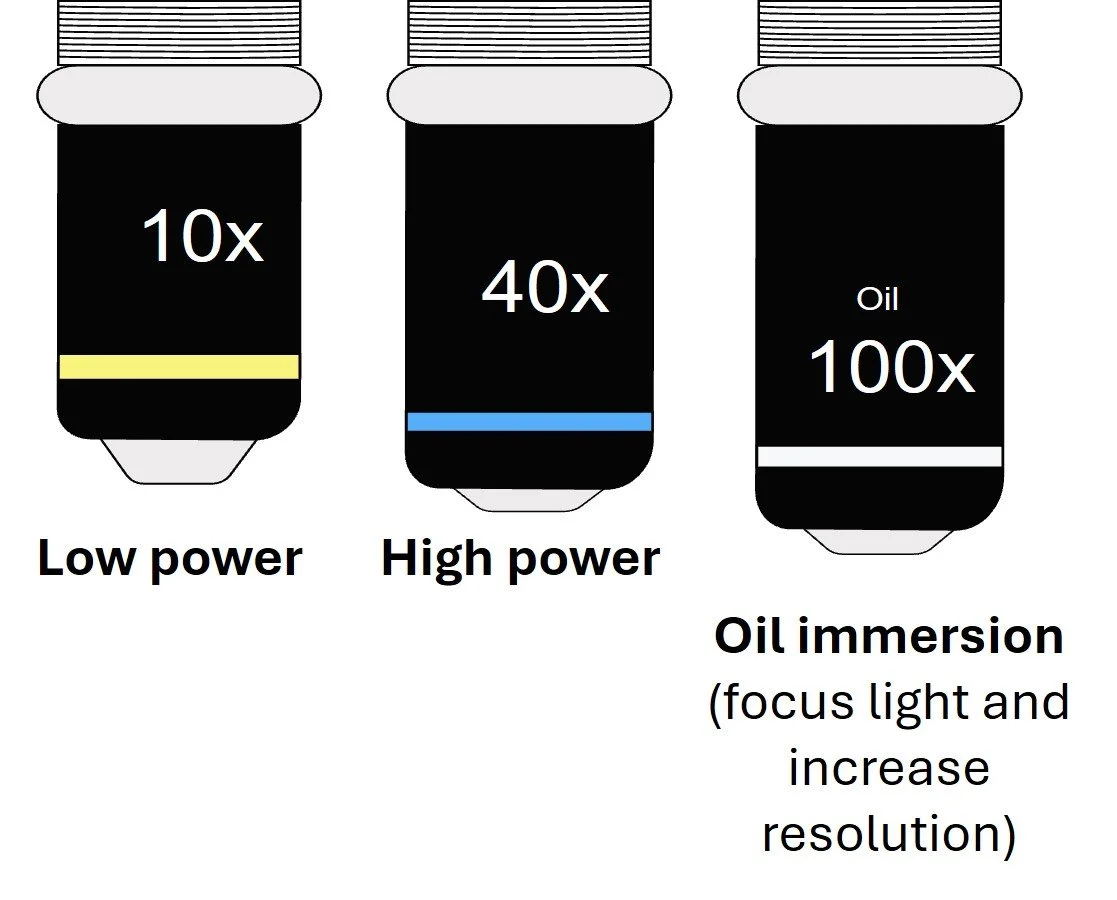
Objective lens are closest to the object and are responsible for both magnifying and increasing the resolution of the object.
Resolution: The ability to separate objects that are close together i.e. more detail.
When figuring out how much a sample has been magnified, you must take into consideration both the eyepiece magnification and the objective lens.
TOTAL MAGNIFICATION = EYEPIECE MAGNIFICATION X OBJECTIVE LENS MAGNIFICATION i.e. a x10 eyepiece lens is used with a x40 objective lens, therefore the total magnification is x400
When using a light microscope, the specimen often needs to be prepared in a way that makes it easier to observe. There are several common techniques you should be familiar with:
Dry mount: Useful for: hairs, pollen grains, insect parts, thin sections of plants.
Use a sharp blade to cut a thin slice (allows light to penetrate) or the whole specimen is placed on the slide with a cover slip on top.
Wet mount: Useful for: aquatic samples, living organisms (e.g. protists), and soft tissues that need support.
Sample is suspended in liquid (water/ immersion oil) to prevent dehydration/ distortion of tissue, cover slip is then lowered at an angle to prevent air bubbles
Squash slides: Useful for: soft samples, e.g. root tips when studying mitosis, to spread cells into a thin layer.
A wet mount is prepared, then gently press down (sometimes with tissue paper) on the cover slip or another microscope slide to squash the specimen.
Smear slides: Useful for: blood samples, to see individual cells clearly.:
A drop of liquid sample (i.e. blood) is placed on the slide using a pipette, then using the edge of another slide the liquid is smeared across the slides before adding a cover slip.


Squash slide showing root tip cells going though mitosis
When you look at a specimen under a microscope, the image is magnified – but the magnification alone doesn’t tell you the actual size of the structure. To measure accurately, you first need to calibrate the microscope.
Calibration is done by using two special tools:
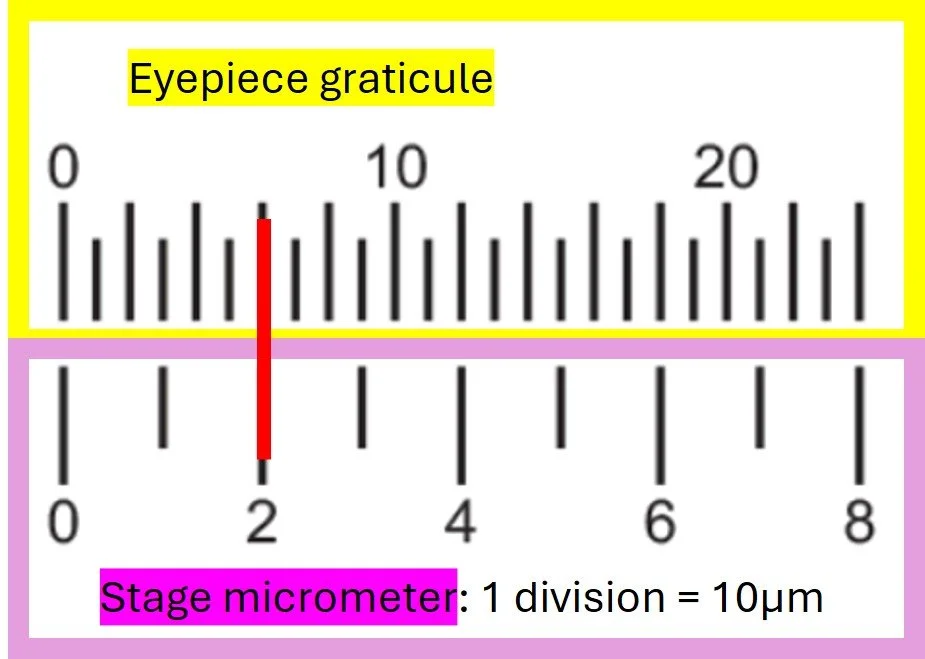
Eyepiece graticule – a small transparent scale inside the eyepiece. It looks like a ruler, but it has no fixed units.
Stage micrometer – a tiny ruler on a microscope slide, with a scale where the divisions are known (usually 0.01 mm or 10 μm)
How to calibrate eyepiece graticule:
Place the stage micrometer on the stage and bring it in to focus.
Line up the stage micrometer with the scale on the eyepiece graticule
Work out how many divisions on the graticule match a known length on the micrometer i.e 2 divisions (2x10μm = 20μm) on the stage micrometer below lines up with 6 division on the eyepiece graticule
From this, calculate the value of one eyepiece division at that magnification. 1 eyepiece graticule division = 20/6 = 3.33μm
Repeat step 2-4 for each of the objective lens
Now, when you place your specimen slide under the microscope, you can use the calibrated graticule to measure the actual size of cells or structures.
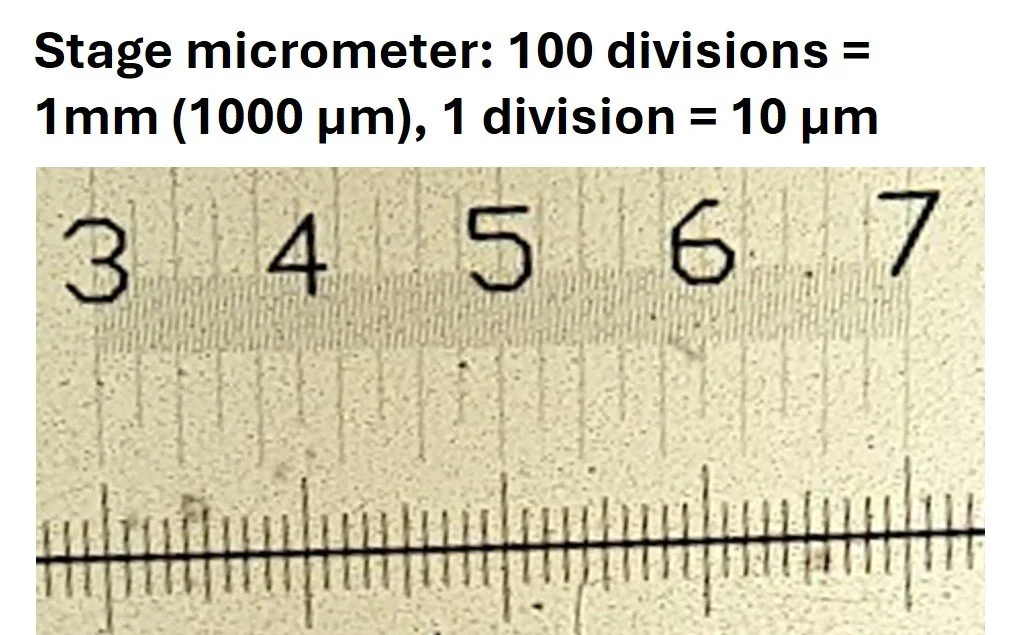
i.e 100 divisions on the stage micrometer above lines up with 40 divisions on the eyepiece graticule: 1000/40 = 25μm
Answer: draw a ruler line from both sides of the vascular bundle down to the graticule scale as shown by the red lines in figure 1.
Count the number of division between the lines (13 divisions).
multiply 13 by the eyepiece graticule unit 25μm: 13 x 25 = 325μm
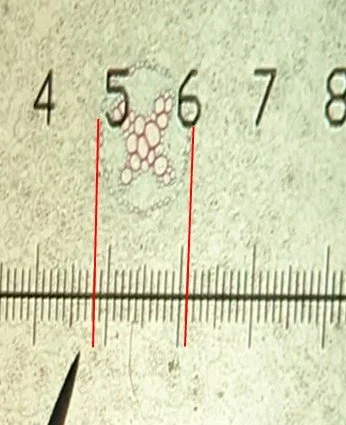
figure 1. vascular bundle seen under the microscope
Example exam practice: Calculate the diameter of the vascular bundle in figure 1. using the calculated eyepiece unit of 25μm
Most biological material is transparent, so stains are used in light microscopy to increase contrast and make structures more visible. Because different cellular components have distinct chemical properties such as charge, polarity, or solubility, stains bind to them in different ways, allowing specific features to be highlighted and different cell types to be identified.
Positively charged (basic) dyes, such as crystal violet and methylene blue, bind to negatively charged components like nucleic acids, cytosol, and thick cell walls. Negatively charged (acidic) dyes, such as nigrosin and Congo red, are repelled by the cytosol and remain outside the cell, often producing negative staining where the background is stained instead. Lipid-soluble dyes, such as Sudan III and Nile blue, stain lipids and membranes, with Sudan III highlighting fat deposits and Nile blue identifying lipids and triglycerides. In addition, differential staining uses more than one dye to distinguish between organisms or cell components—for example, Gram staining differentiates Gram-positive from Gram-negative bacteria, while haematoxylin and eosin (H&E) are widely used in histology to stain nuclei blue/purple and cytoplasm pink.

How to stain a sample:
Use forceps to place the thin sample on a glass slide, allow to air dry
Heat-fix sample by passing it through a flame
.Pipette stain at edge of sample
lower cover slip at an angle using a mounted needle
blotting paper (blue towel) to, remove excess stain. This pulls the stain through using capillary action
use more than one stain (to improve contrast) makes cells (gram-positive/ gram negative) or components visible (DNA/ cytoplasmic proteins)
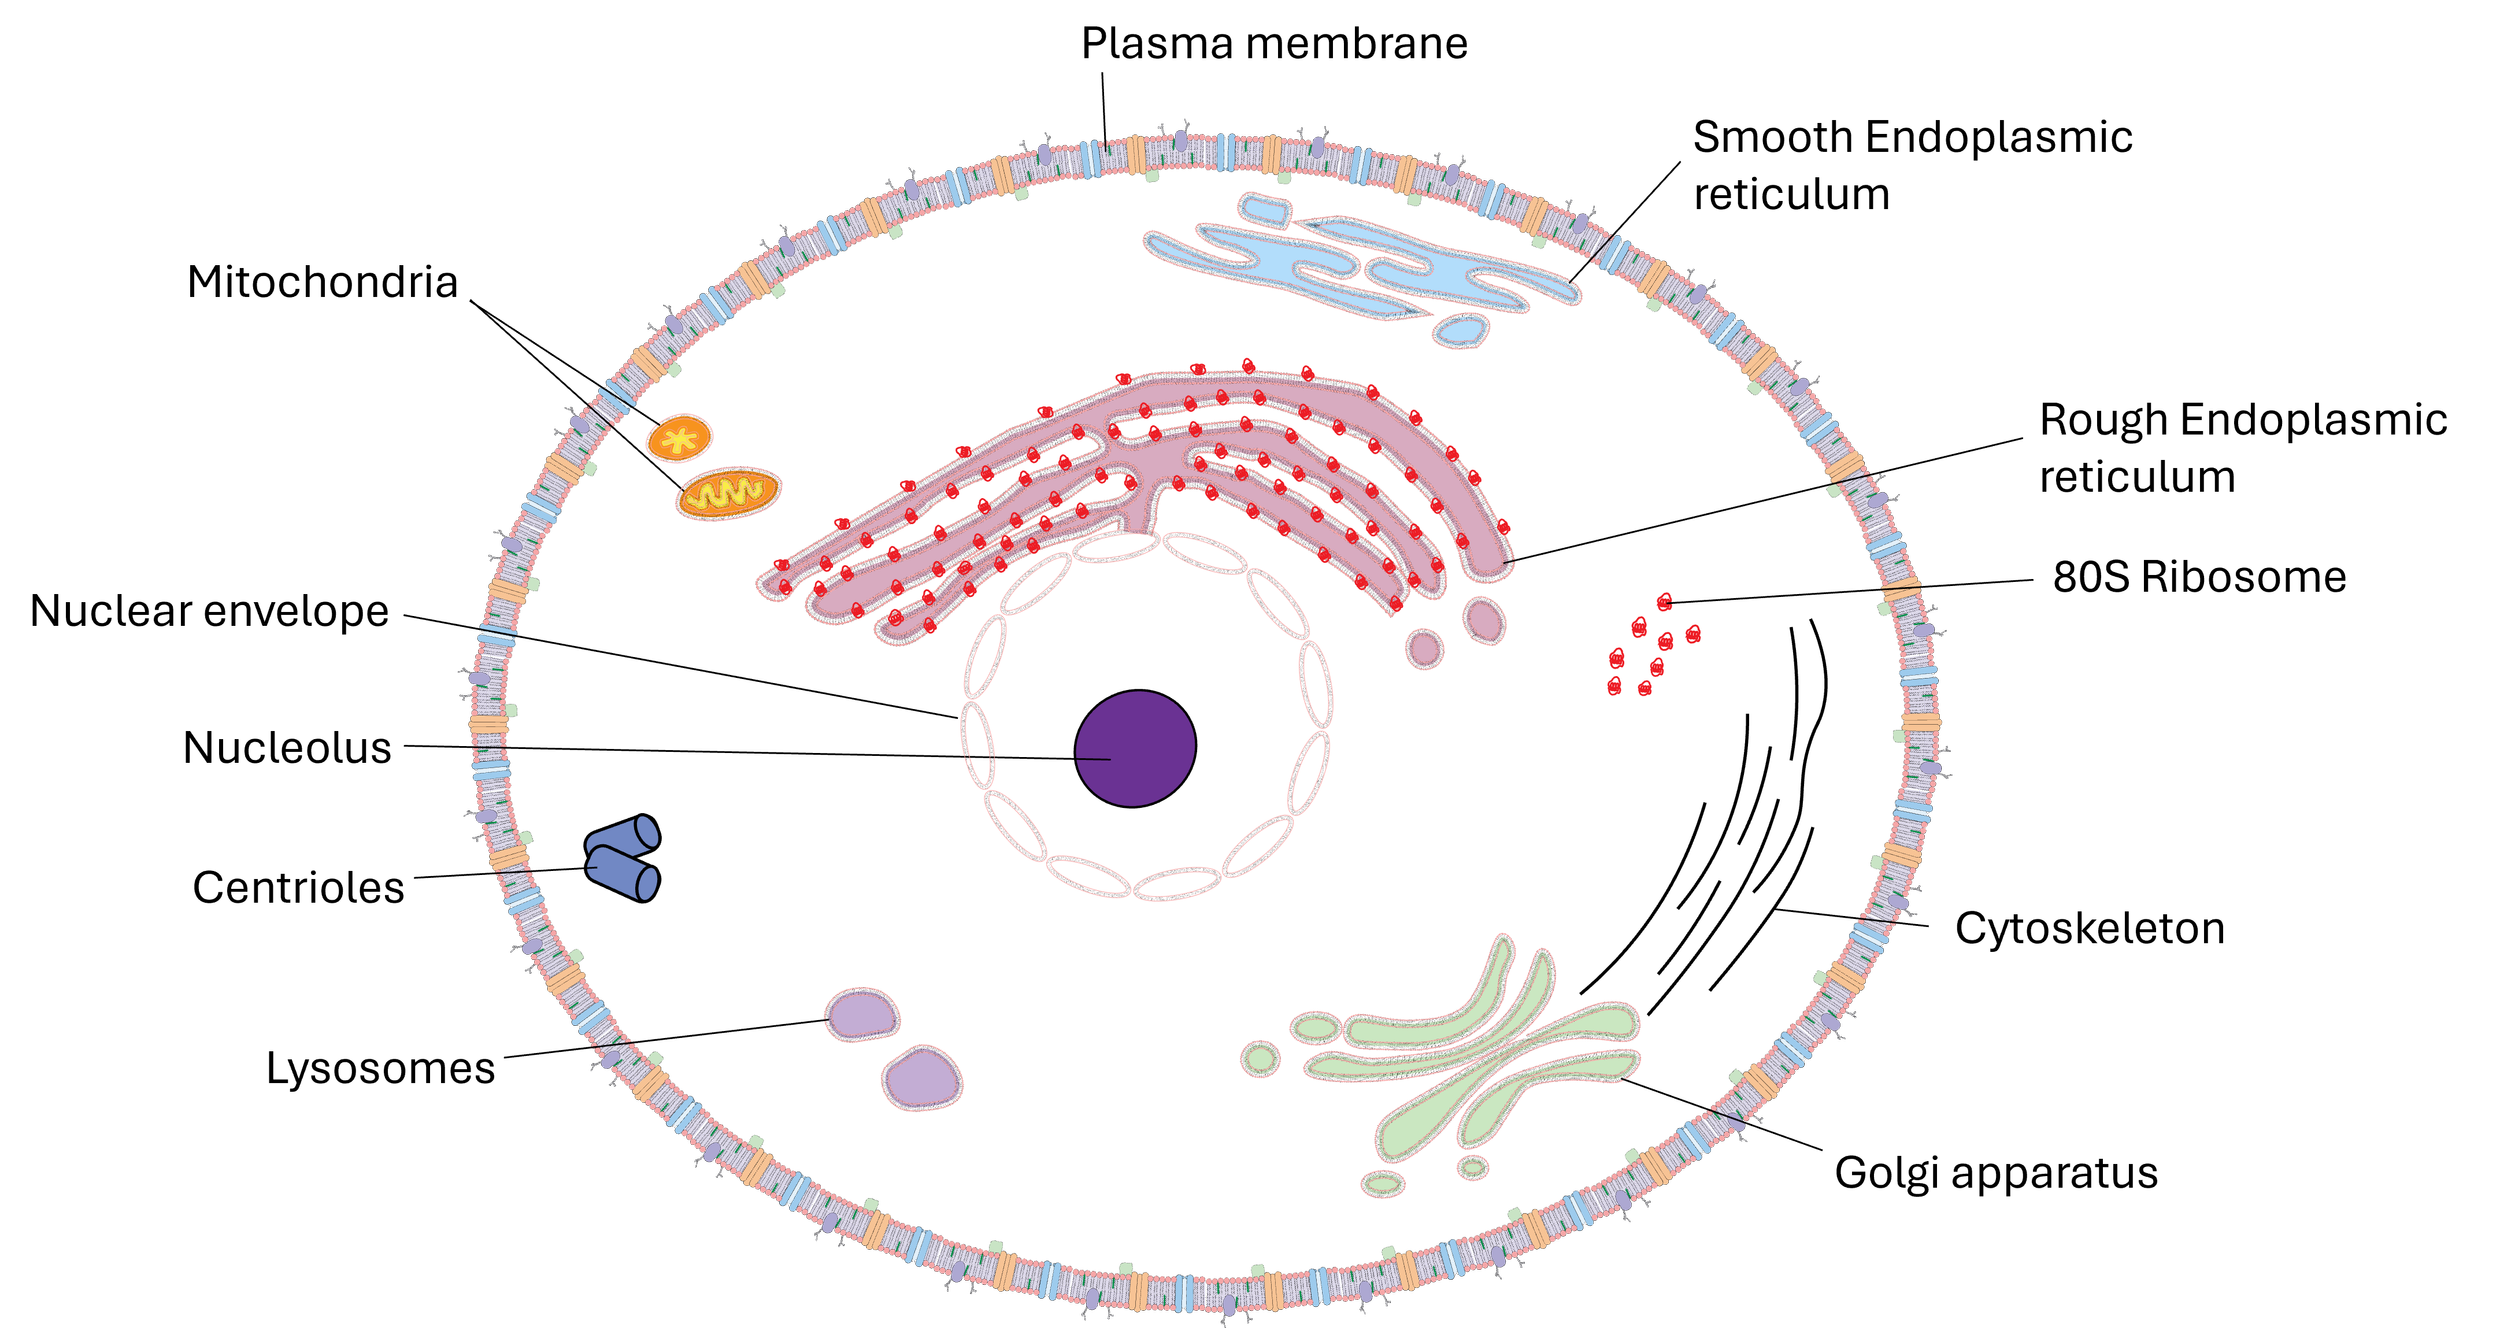
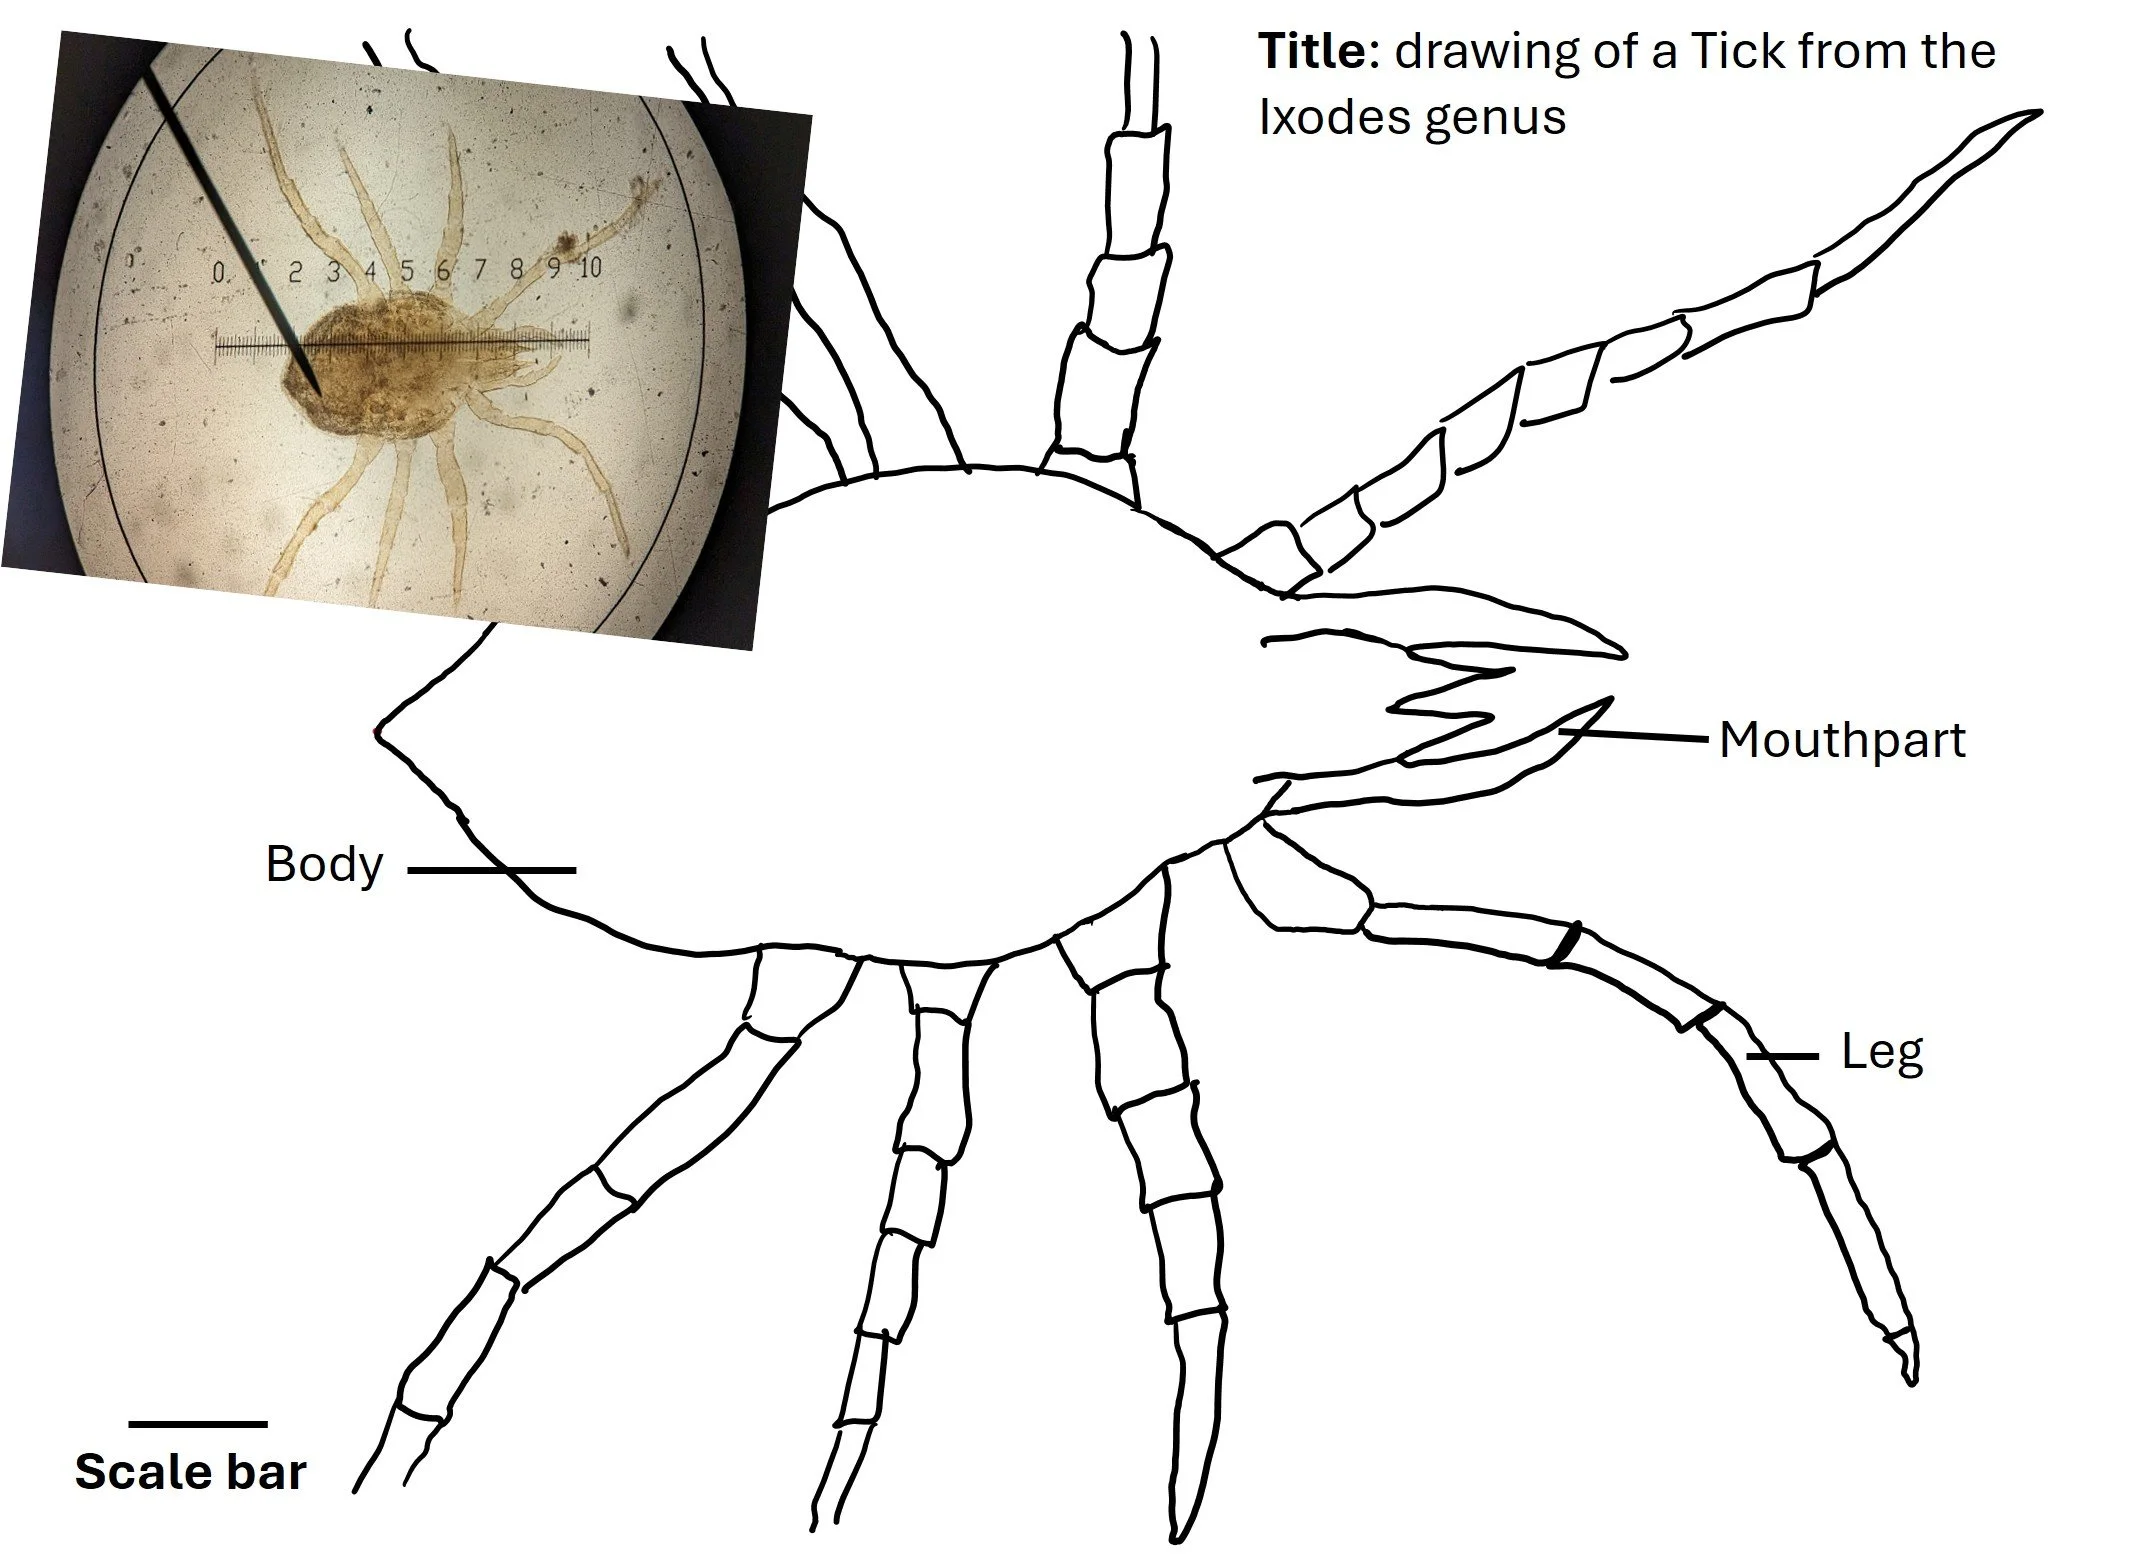
When observing cells under a light microscope, drawings and annotated diagrams are used to accurately represent what is seen. These representations should show the main features visible at that level of magnification and resolution, such as the nucleus, cytoplasm, cell membrane, and cell wall (in plant cells). In tissue sections, additional structures may be visible, including mitochondria, chloroplasts, vacuoles, and different tissue arrangements.
Scientific drawings must follow strict rules: they should have a clear title and include a scale bar or magnification to indicate size. Drawings must be neat, proportional, and fill at least half the space provided, with outlines in single (continuous), sharp lines (no shading). Labels must be precise, straight, and not crossed, and only observed structures should be included rather than textbook details. Annotated diagrams go further by not only labelling structures but also explaining their function or significance, for example, “nucleus – contains genetic information” or “chloroplast – site of photosynthesis.”
The magnification formula is an essential tool in microscopy for calculating the relationship between the size of an image, the actual size of the specimen, and the level of magnification. It is written as:
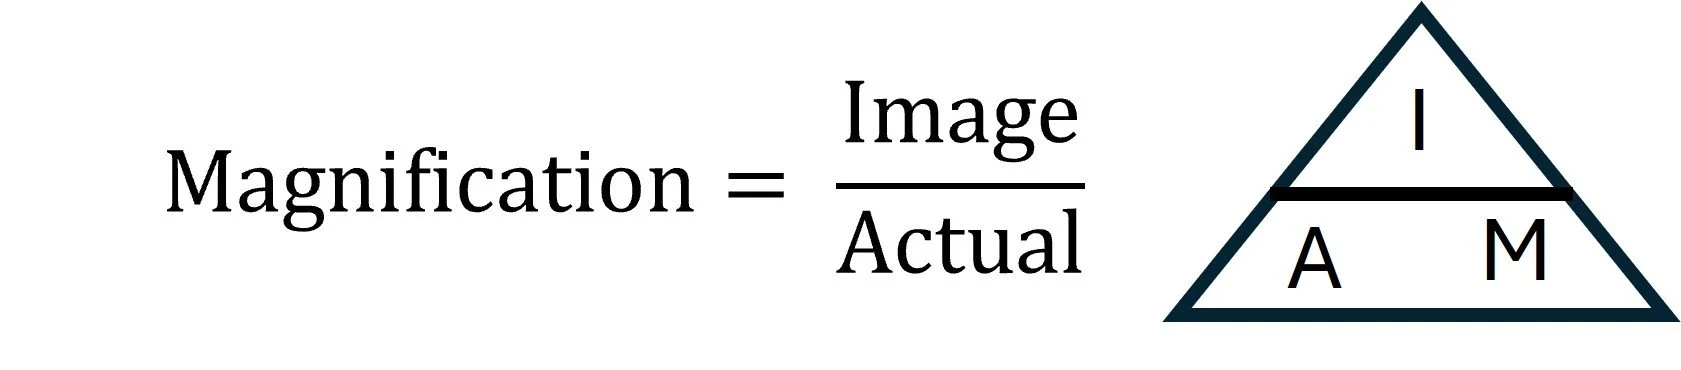
By rearranging the formula, either the actual size of a specimen or the magnification can be calculated if the other two values are known. Accurate use and manipulation of this formula are important for interpreting microscope images, making measurements, and comparing structures at different scales.
Using the Magnification Formula with a Scale Bar
If a biological drawing or diagram has a scale bar, the first step is to measure the scale bar with a ruler.
Example:
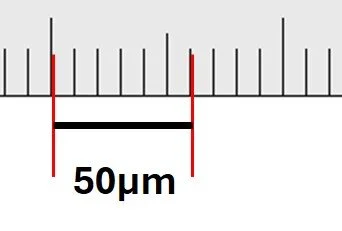
The scale bar in the diagram measures 6 mm with a ruler.
The actual size shown by the scale bar is 50 μm.
Step 1 – Convert units so they are the same:
image size: 6mm (x1000) = 6000μm
Step 2 – Apply the magnification formula:

The diagram is 120x magnified compared to the actual specimen observed under the microscope.
The resolution of a microscope depends on the wavelength of the rays used to form the image.
A light microscopes resolution is limited by the wavelength of light. Electrons have a shorter wavelength than light, therefore, electron microscopes have a higher resolution than the light microscope.
There are two types of electron microscopes:
Transmission electron microscope (TEM) -
Resolution: 0.05 - 2 nm (highest)
electrons are transmitted through ultra-thin sections, creating a 2D image.
shows cell ultrastructure, including organelles
requires a vacuum
Scanning electron microscope (SEM)
Resolution: 5-50 nm
Electrons are reflected from the specimen surface, producing a 3D image.
Shows surface details of cells and tissues.
Requires a vacuum
Resolution: The ability to separate objects that are close together i.e. more detail.
2.1.1 Cell structure -Eukaryotic cells
The development of microscopes has allowed us to be able distinguish between different types of cells and the structures inside.